3D shape, 3D Curve and 3D Ball in VB .Net using GDI+ | |
| The most basic form of graphics programming in Visual Basic.Net utilizes a collection of classes known as GDI+. | |
| GDI+ stands for Graphics Device Interface Plus and the reason for the plus suffix is because prior to GDI+ | |
| there was GDI so it is there to be shown as an improvement over its predecessor. | |
| The GDI+ classes reside in the System.Drawing namespace and some classes are: | |
| System.Drawing.Bitmap | |
| System.Drawing.Graphics | |
| System.Drawing.Icon | |
| System.Drawing.Image | |
| Once you have a canvas to draw on, you need to have some kind of object to start the drawing, the | |
| System.Drawing.Graphics class is what takes care of the drawing operations in | |
| Visual Basic.Net. There are three different methods to use the Graphics class, one method accesses | |
| a Graphics object that already exist while the other two methods actually create a Graphics object. | |
| In order to access a Graphics object that already exists, you must utilize the PaintEventArgs in a | |
| control’s Paint event. This is the parameter e in the event declaration: | |
Private Sub Form1_Paint(ByVal sender As Object, ByVal e As PaintEventArgs) Handles MyBase.Paint
Dim g As Graphics = e.Graphics
End Sub
|
| Or get that of PictureBox1 control like the following code: |
Dim g As System.Drawing.Graphics g = PictureBox1.CreateGraphics |
| Open Microsoft Visual Studio 2019 community or with licenze and select a New Project on the File menu. | |
| Select Visual Basic, Windows Form Application then click OK, insert the first form Form1, | |
| from the toolbar insert three buttons Button1, Button2 and Button3 | |
| add an other control PictureBox1 for the drawing | |
| In this project you need to declare the following variables | |
Dim g As System.Drawing.Graphics
Dim pen1 As New System.Drawing.Pen(Color.Blue, 0.5) ' the pen with a specific color
Const PI = 3.14159
Dim flag, col, r, h, hl, n, n1 As Short
Dim x, y, z, cx, cy, cz, thx, thy, thz As Single
Dim point1, point2, point3, point4, point5 As System.Drawing.Point
|
| Double click on the Button1 and add the following code |
Private Sub Button1_Click(sender As Object, e As EventArgs) Handles Button1.Click
Dim th As Single
Static ax(9), ay(9), az(9)
Static bx(9), by(9), bz(9)
h = 160 : thy = 0.2
col = 0 : n1 = 1
r = 100
n = 8
thx = 0.2
PictureBox1.Refresh()
ax(0) = h : ay(0) = h : az(0) = h
n1 = 1
For th = 0 To 2 * PI + 0.1 Step 2 * PI / n
x = r * Math.Cos(th) : y = -h : z = r * Math.Sin(th)
Call dzorotationX() : Call dzorotationX()
bx(n1) = x : by(n1) = y : bz(n1) = z
n1 = n1 + 1
Next th
For n1 = 1 To n
x = ax(n1) : y = ay(n1)
Call dzodrawline()
x = ax(n1 + 1) : y = ay(n1 + 1)
Call dzodrawline()
x = bx(n1 + 1) : y = by(n1 + 1)
Call dzodrawline()
x = bx(n1) : y = by(n1)
Call dzodrawline()
Next n1
End Sub
|
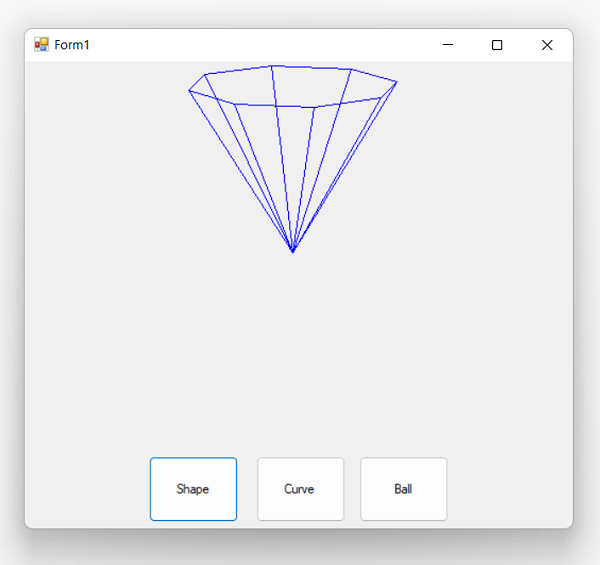
| And here is the result after execution | |
 | |
| Double click on the Button2 and add the following code | |
Private Sub Button2_Click(sender As Object, e As EventArgs) Handles Button2.Click
PictureBox1.Refresh()
g = PictureBox1.CreateGraphics
Dim x, y, s, cx, cy, zz, xx, yy As Single
Dim h, a, b, sx, sx1, sx2, sy, sy1, sy2 As Integer
Dim x1, x2, y1, y2, xw, yw As Integer
s = pi / 16
x1 = -3
x2 = 3
xw = x2 - x1
y1 = -9 : y2 = 9 : yw = y2 - y1
sx1 = 140 : sx2 = 600
sy1 = 360 : sy2 = 100
cx = (sx2 - sx1) / xw
cy = (sy1 - sy2) / yw
h = 170 : a = 6 : b = 6
For y = y1 + 6 To y2 - 6 Step 1 / cy
For x = x1 To x2 Step 1 / cx * 2
zz = h * Math.Exp(-x * x / a * a - y * y / b * b)
xx = x * cx + sx1 + 160
yy = sy1 - y * cy
sx = Int(xx + y * cy * Math.Cos(s))
sy = yy - zz
sy = sy - 100
If x = -3 Then
point1.X = sx - 60 : point1.Y = sy - 20
Else : point2.X = sx - 60 : point2.Y = sy - 20
g.DrawLine(pen1, point1, point2)
point1 = point2
End If
Next x
Next y
End Sub
|
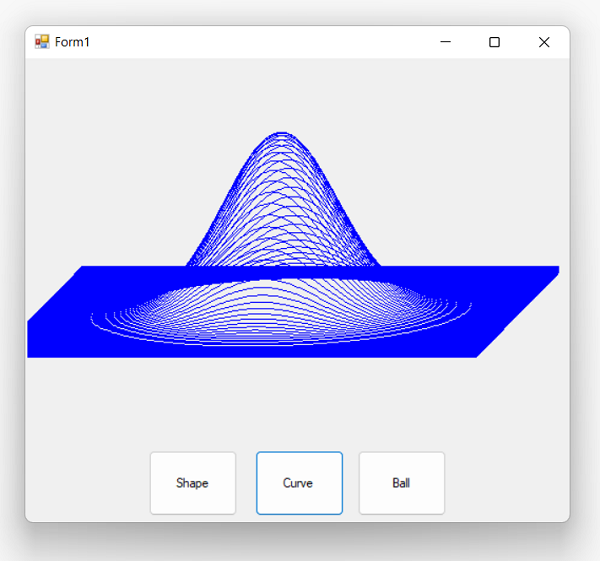
| And here is the result after execution | |
 | |
| Double click on the Button3 and add the following code | |
Private Sub Button3_Click(sender As Object, e As EventArgs) Handles Button3.Click
PictureBox1.Refresh()
g = PictureBox1.CreateGraphics
Dim i, r As Integer
Dim x, y, z, s, q, p, px, py As Single
Dim mx(600), my(600) As Integer
s = pi / 4
r = 100
i = 1
q = -pi / 2 + 0.1
For p = 0 To 2 * pi Step 0.2
x = r * Math.Cos(q) * Math.Sin(p)
y = r * Math.Sin(q)
z = r * Math.Cos(q) * Math.Cos(p)
px = x * 1.2
py = y - z * Math.Sin(s)
mx(i) = px + 200
my(i) = 150 - py
i = i + 1
Next p
point1.X = mx(1) : point1.Y = my(1)
For q = -pi / 2 + 0.2 To pi / 2 Step 0.2
i = 1
For p = 0 To 2 * pi Step 0.2
x = r * Math.Cos(q) * Math.Sin(p)
y = r * Math.Sin(q)
z = r * Math.Cos(q) * Math.Cos(p)
px = x * 1.2
py = y - z * Math.Sin(s)
point2.X = px + 200 : point2.Y = 150 - py
g.DrawLine(pen1, point1, point2)
point1 = point2
point3.X = mx(i) : point3.Y = my(i)
point4.X = px + 200 : point4.Y = 150 - py
g.DrawLine(pen1, point3, point4)
point3 = point4
mx(i) = px + 200
my(i) = 150 - py
i = i + 1
Next p
p = 0
x = r * Math.Cos(q) * Math.Sin(p)
y = r * Math.Sin(q)
z = r * Math.Cos(q) * Math.Cos(p)
px = x * 1.2
py = y - z * Math.Sin(s)
point5.X = px + 200 : point5.Y = 150 - py
g.DrawLine(pen1, point4, point5)
point4 = point5
Next q
End Sub
|
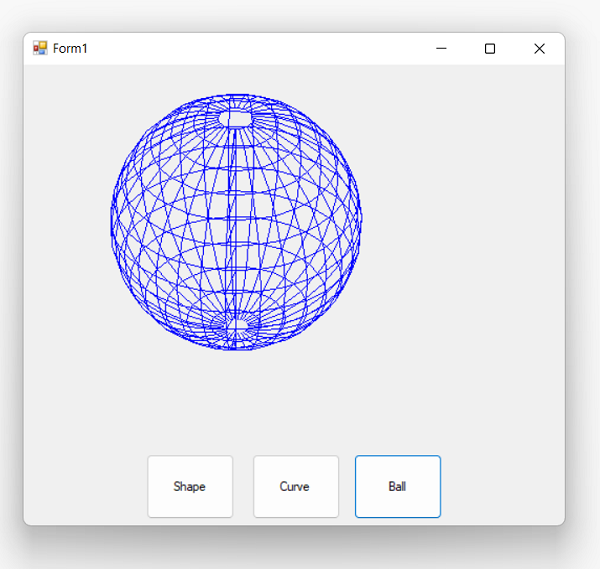
| And here is the result after execution | |
 | |
| Finally you will have the following code inside our class Form1 | |
Public Class Form1
Dim g As System.Drawing.Graphics
Dim pen1 As New System.Drawing.Pen(Color.Blue, 0.5)
Const PI = 3.14159
Dim flag, col, r, h, hl, n, n1 As Short
Dim x, y, z, cx, cy, cz, thx, thy, thz As Single
Dim point1, point2, point3, point4, point5 As System.Drawing.Point
Private Sub Button1_Click(sender As Object, e As EventArgs) Handles Button1.Click
Dim th As Single
Static ax(9), ay(9), az(9)
Static bx(9), by(9), bz(9)
h = 160 : thy = 0.2
col = 0 : n1 = 1
r = 100
n = 8
thx = 0.2
PictureBox1.Refresh()
ax(0) = h : ay(0) = h : az(0) = h
n1 = 1
For th = 0 To 2 * PI + 0.1 Step 2 * PI / n
x = r * Math.Cos(th) : y = -h : z = r * Math.Sin(th)
Call dzorotationY() : Call dzorotationX()
bx(n1) = x : by(n1) = y : bz(n1) = z
n1 = n1 + 1
Next th
For n1 = 1 To n
x = ax(n1) : y = ay(n1)
Call dzodrawline()
x = ax(n1 + 1) : y = ay(n1 + 1)
Call dzodrawline()
x = bx(n1 + 1) : y = by(n1 + 1)
Call dzodrawline()
x = bx(n1) : y = by(n1)
Call dzodrawline()
Next n1
End Sub
Public Sub dzodrawline()
Dim gx, gy As Single
gx = 250 + x
gy = 180 + y
If flag = 0 Then point1.X = gx : point1.Y = gy
flag = 1
point2.X = gx : point2.Y = gy
g = PictureBox1.CreateGraphics
g.DrawLine(pen1, point1, point2)
point1 = point2
End Sub
Private Sub dzorotationX()
Dim yw, zw As Single
yw = y : zw = z
y = yw * Math.Cos(thx) - zw * Math.Sin(thx)
z = yw * Math.Sin(thx) + zw * Math.Cos(thx)
End Sub
Private Sub dzorotationY()
Dim zw, xw As Single
zw = z : xw = x
x = zw * Math.Cos(thy) - xw * Math.Sin(thy)
z = zw * Math.Sin(thy) + xw * Math.Cos(thy)
End Sub
Private Sub Button2_Click(sender As Object, e As EventArgs) Handles Button2.Click
PictureBox1.Refresh()
g = PictureBox1.CreateGraphics
Dim x, y, s, cx, cy, zz, xx, yy As Single
Dim h, a, b, sx, sx1, sx2, sy, sy1, sy2 As Integer
Dim x1, x2, y1, y2, xw, yw As Integer
s = pi / 16
x1 = -3
x2 = 3
xw = x2 - x1
y1 = -9 : y2 = 9 : yw = y2 - y1
sx1 = 140 : sx2 = 600
sy1 = 360 : sy2 = 100
cx = (sx2 - sx1) / xw
cy = (sy1 - sy2) / yw
h = 170 : a = 6 : b = 6
For y = y1 + 6 To y2 - 6 Step 1 / cy
For x = x1 To x2 Step 1 / cx * 2
zz = h * Math.Exp(-x * x / a * a - y * y / b * b)
xx = x * cx + sx1 + 160
yy = sy1 - y * cy
sx = Int(xx + y * cy * Math.Cos(s))
sy = yy - zz
sy = sy - 100
If x = -3 Then
point1.X = sx - 60 : point1.Y = sy - 20
Else : point2.X = sx - 60 : point2.Y = sy - 20
g.DrawLine(pen1, point1, point2)
point1 = point2
End If
Next x
Next y
End Sub
Private Sub Button3_Click(sender As Object, e As EventArgs) Handles Button3.Click
PictureBox1.Refresh()
g = PictureBox1.CreateGraphics
Dim i, r As Integer
Dim x, y, z, s, q, p, px, py As Single
Dim mx(600), my(600) As Integer
s = pi / 4
r = 100
i = 1
q = -pi / 2 + 0.1
For p = 0 To 2 * pi Step 0.2
x = r * Math.Cos(q) * Math.Sin(p)
y = r * Math.Sin(q)
z = r * Math.Cos(q) * Math.Cos(p)
px = x * 1.2
py = y - z * Math.Sin(s)
mx(i) = px + 200
my(i) = 150 - py
i = i + 1
Next p
point1.X = mx(1) : point1.Y = my(1)
For q = -pi / 2 + 0.2 To pi / 2 Step 0.2
i = 1
For p = 0 To 2 * pi Step 0.2
x = r * Math.Cos(q) * Math.Sin(p)
y = r * Math.Sin(q)
z = r * Math.Cos(q) * Math.Cos(p)
px = x * 1.2
py = y - z * Math.Sin(s)
point2.X = px + 200 : point2.Y = 150 - py
g.DrawLine(pen1, point1, point2)
point1 = point2
point3.X = mx(i) : point3.Y = my(i)
point4.X = px + 200 : point4.Y = 150 - py
g.DrawLine(pen1, point3, point4)
point3 = point4
mx(i) = px + 200
my(i) = 150 - py
i = i + 1
Next p
p = 0
x = r * Math.Cos(q) * Math.Sin(p)
y = r * Math.Sin(q)
z = r * Math.Cos(q) * Math.Cos(p)
px = x * 1.2
py = y - z * Math.Sin(s)
point5.X = px + 200 : point5.Y = 150 - py
g.DrawLine(pen1, point4, point5)
point4 = point5
Next q
End Sub
End Class
|
Conclusion | |
| Hopefully you learned how to draw in Visual Basic.Net using GDI+. As you can tell, drawing is fairly | |
| simple but can have its pitfalls such as not utilizing the Using statements when declaring the various objects. | |

